WSJT-X / JTDX / MSHV Band Map
Swisslog implements a very complete Band map function to monitor WSJT-X, JTDX or MSHV activity. It has the following features:
-
Data source selection: you can select to monitor the main instance (default option) or any of the 5 Log QSO request instances. Please read WSJT-X / JTDX UDP settings.
-
Double clicking in a call/grid does the same action as double clicking in the message in the "Band activity" window of WSJT-X / JTDX
-
Wide zoom in/out range
-
Custom font size
-
Resizable window
-
Full message details (including if LotW/eQSL user) when placing mouse cursor over a call
-
Dupe control for band or band/mode (user selectable) displaying (D) if dupe. You can also hide all band/mode dupes!
-
Show/Hide SNR/DT/Grids.
-
Customizable statistic selection! DXCC-DATA is the default statistic but user can select any available statistic
-
You can also select the statistic you want to check the status for gridsquares.
-
Gradient colors for frequency ruler
-
Colors customization: background, ruler gradients, ruler measures and frequency.
-
You can have as many band maps as you want with different filters (needed, worked, etc), specific modes (FT8, JT65, etc), colours, statistics, font and window size, etc.
-
Even you can place every band map as standalone window for dual monitor systems!
-
You can also send messages to your SDR Panorama if using TCI (ExpertSDR) or Flex Radio as transceiver control.
The Band Map window
The Band Map window offers a graphical view of the whole band activity which is very interesting and nice looking! You can open as many band maps as you want! Each window can display different statistic and use a different set of filters, settings, etc. It's a very good complement for WSJT-X, JTDX or MSHV because you can check the status for statistics not supported by the colour system of these programs such as WAS or POTA. But it's also useful to check other statistics to only see traffic of what you really need for the selected statistic, by changing the selection criterias.
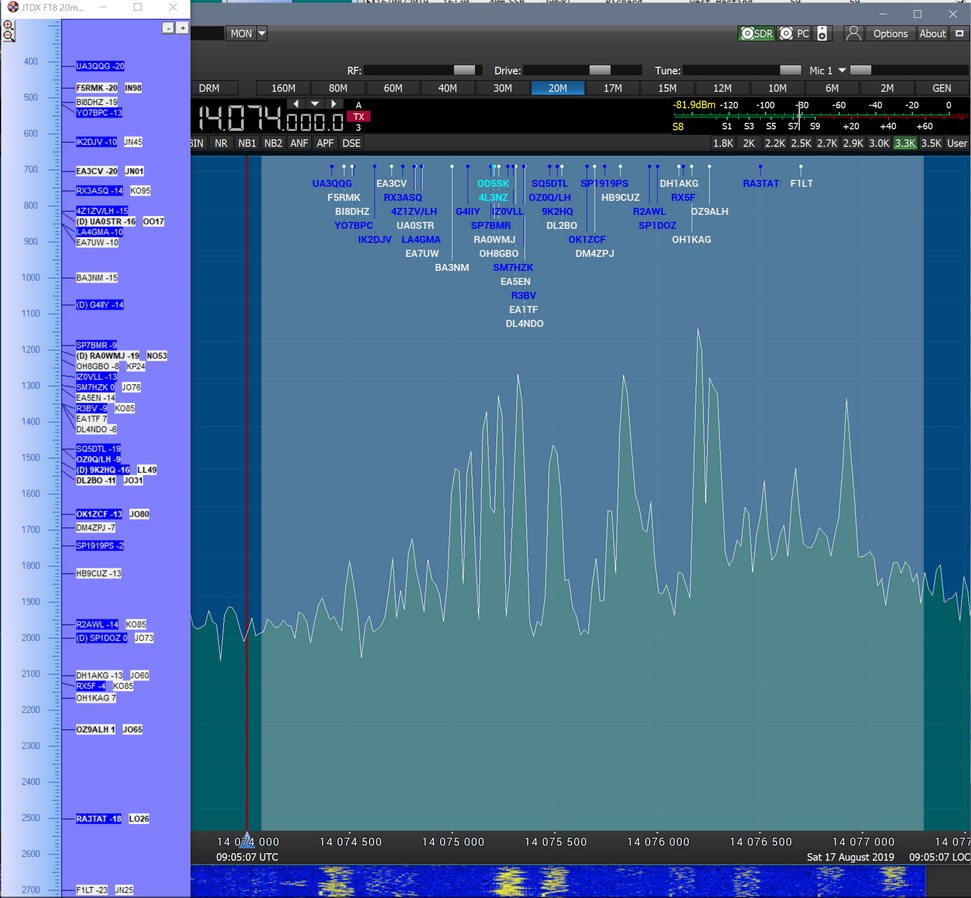
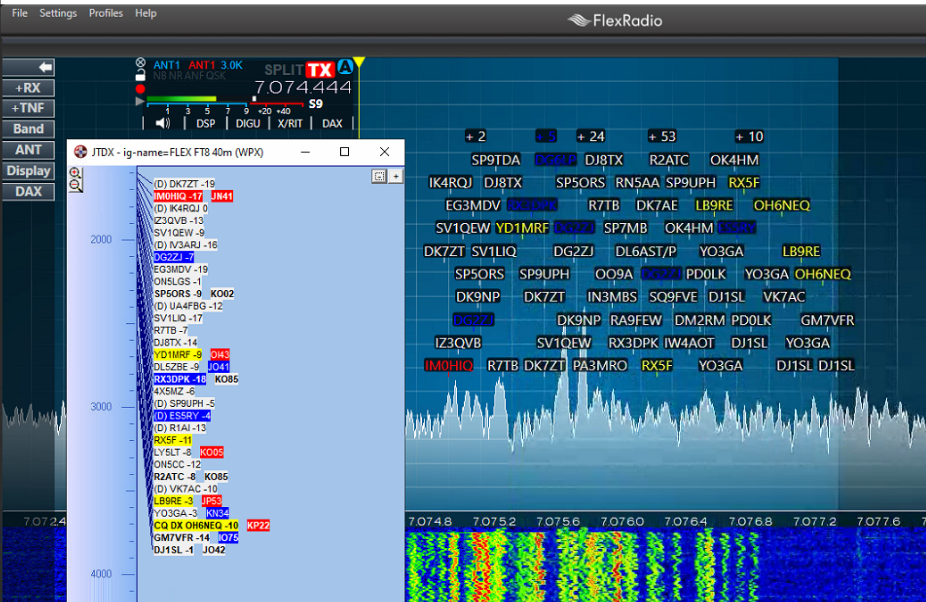
To open a WSJT-X / JTDX / MSHV Band Map window select View | WSJT-X / JTDX / MSHV Band Map. This is what the window looks like:
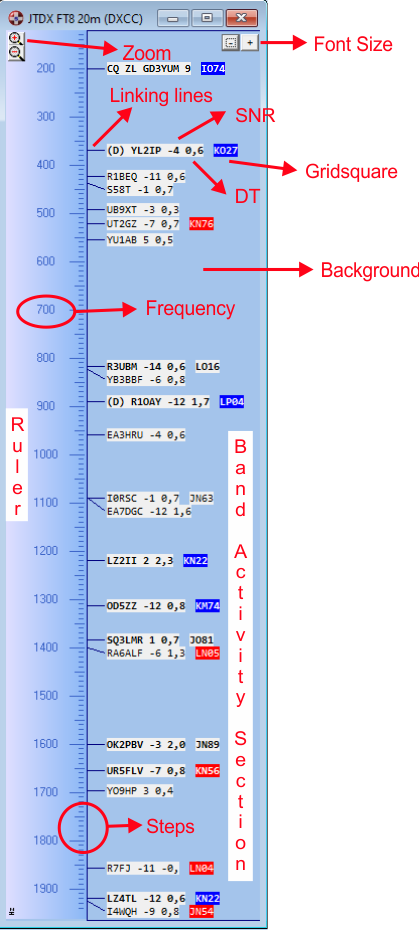
The window title will show the program which Swisslog is receiving messages (WSJT-X, JTDX or MSHV), the current mode and band and the selected statistic for the band map (by default is DXCC-DATA).
By default, Band Map will be reading traffic from the Main instance. The Instance selector dropdown list allows user to select any of the defined 5 Log QSO request instances. In order to make selection easier, the list will contain the program name, mode and band received from the corresponding instance. This is very useful if you are using several WSJT-X/JTDX/MSHV instances and you want to have different band maps to monitor traffic from several instances for different statistics.
Use the zoom buttons to enlarge/narrow the bandwidth by pressing the correspondig + or - buttons respectively (or by using the mouse wheel: place the mouse cursor over a call and move mouse wheel up/down. Selected callsign will be centered in the band map). You can also move the dial up/down by dragging the ruler with your mouse (left click, hold and drag up/down). You can resize the band map window to the size you need.
Use the + - buttons to change the font size of Callsigns and Gridsquares.
By placing the mouse cursor over any call/grid you will see the message details (including if LotW/eQSL user or US State for US Calls if found in the embedded FCC database):
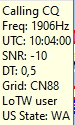
IMPORTANT: Searching US State in the FCC database may affect performance according your computer, number of QSO in your logbook, spot traffic and parallel software being executed along with Swisslog. If you experience this o simply don't want to use this feature, it can be disabled in Options / Query US State to the FCC database for DX message and Band Maps windows.
At the left bottom part of Swisslog you will see the audio frequency corresponding to the mouse cursor position.
Double clicking in a call/grid does the same action as double clicking in the message in the "Band activity" window of WSJT-X / JTDX. IMPORTANT: You have to enable the "Accept UDP Request" option in Settings > Reporting. In WSJT-X, this will only work if replying a CQ or QRZ message. In JTDX, user can choose whether accepting UDP replies from CQ, CQ and 73 or any messages in Misc > Accept UDP reply messages (CQ is the default option). This function won't work if you use JT Alert along with Swisslog!.
WSJT-X / JTDX / MSHV Band map is also very useful to know the split frequency when working DX. You can easily check out if you are hearing the QSO partner of the DX station to know the split frequency for such QSO.
If the station is calling CQ to any specific direction such as EU, AS, JA, ZL, etc. it will be shown preceding the callsign (i.e CQ JA EA3GCV).
Options
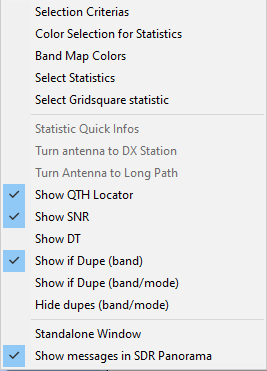
The following options and functions are available via the pop-up menu (right mouse button):
-
Selection Criterias: Mark the modes for which messages should be displayed and select which callsigns/gridsquares you want to see according their statitstic status (New, needed, worked, all). You can also set the Messages Lifetime in seconds (default value: 180 seconds = 3 minutes). Only messages within the defined period of time will be displayed. IMPORTANT: Using lifetime values higher than 180 seconds is not useful because you will shortly have a full band map and this will affect overall performance if band is very crowded. Lifetime value is limited to 600 seconds (10 minutes).

-
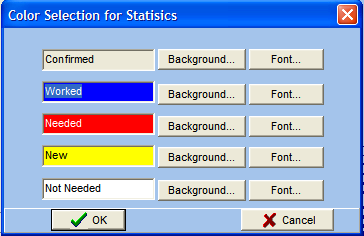
Color Selection for Statistics: allows you to select the color you want to see in Callsigns/Gridsqaure according to its status (Confirmed, Worked, Need, New or Not Needed):
-
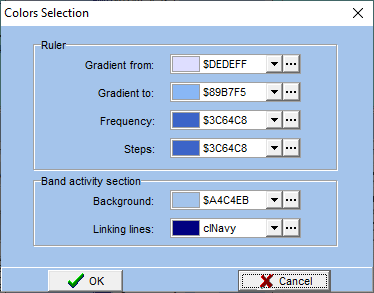
Band Map Colors: allows you to change the color of most parts of the band map. You can create very nice looking band maps according to the user preferences:
-
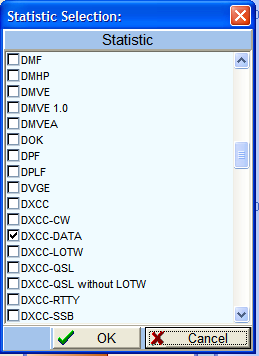
Select Statistics: allows you to select the statistic from which you want to see the status for every Callsign. Select only one statistic! By default DXCC-DATA is selected. IMPORTANT: DON'T select here any gridsquare based statistic!! Gridsquare statistics must be selected in the "Select Gridsquare statistic" option.
Hint: The selected statistic will be displayed in the Band Map window title. If you need to see another statistic simply open a new WSJT-X / JTDX / MSHV Band Map window and select the desired statistic.
-
Select Gridsquare statistic: allows you to select the statistic from which you want to see the status for every gridsquare. Select only one statistic!. By default GRIDSQUARE is selected (which only counts QSL card confirmations). If you want a statistic counting all confirmations (LoTW, eQSL and QSL Cards), select GAPA Grid.
-
Statistic-Quick-Infos: mouse right click over a callsign/gridsquare and select this option to display the Statistic-Quick Info window for the selected callsign.
Hint: If the Statistic-Quick Info window is open, mouse left click on a callsign/gridsquare to display the Info for the selected callsign.
-
Turn antenna to DX station and Turn antenna to Long path: mouse right click over a callsign and select one of these options according to your needs.
-
Show QTH Locator, Show SNR and Show DT: Check the ones you need according to your needs. By default, all are enabled except Show DT.
-
Show if Dupes: Swisslog can check if a monitored call is dupe. If dupe (D) is added before the callsign. i.e: (D) EA3GCV.
-
Show if Dupe (band): This option is checked by default. Swisslog checks if it's dupe on the same band regardless the mode. You can switch to band/mode checking (see below) or disable dupe checking (both options unchecked).
-
Show if Dupe (band/mode): Swisslog checks if it's dupe on the same band and mode. You can switch to band checking (see upper option) or disable dupe checking (both options unchecked).
-
Hide dupes (band/mode): Check this option to not display dupes on the same band and mode.
-
-
Standalone Window: usually the window can not be moved out of the mainframe of SWISSLOG. if this option is set then the Window can be moved anywhere. This is especially useful for PCs with multiple monitors.
-
Always On Top: This option is displayed and enabled by default only when window is set as standalone. Window will stay on top over all other windows of other programs all the time. Warning: If this option is unchecked, window can be hidden behind the main SWISSLOG window or even placed outside of the visible space. If you place it outside of the visible space (i.e. when you change the screen resolution) you can only bring it back by editing the SWISSLOG.INI file.
-
Show messages in SDR Panorama: this option is only available if using TCI/Flex Radio for transceiver control. If checked (default option) all displayed messages will be sent to the Panorama/Panadapter in your SDR. The font color of every message in your SDR will match with the background color selected to identify the statistic status (Confirmed, Worked, Need, New or Not Needed).
If you use Flex Radio, the following info is sent for every message:
-
The spot life time in your SDR will be the same as set in the selected band map.
-
CQ direction in case station is calling CQ EU, CQ DX, CQ JA, etc.
-
QTH Locator
-
LoTW/eQSL user
-
Duplicate QSO (if the Show if Dupe option is enabled)
-
US State for US stations if found in the embedded FCC database.
-
All settings (window size and position, font size, zoom, statistic, statistic filter, colors, etc.) will be saved for every band map window.
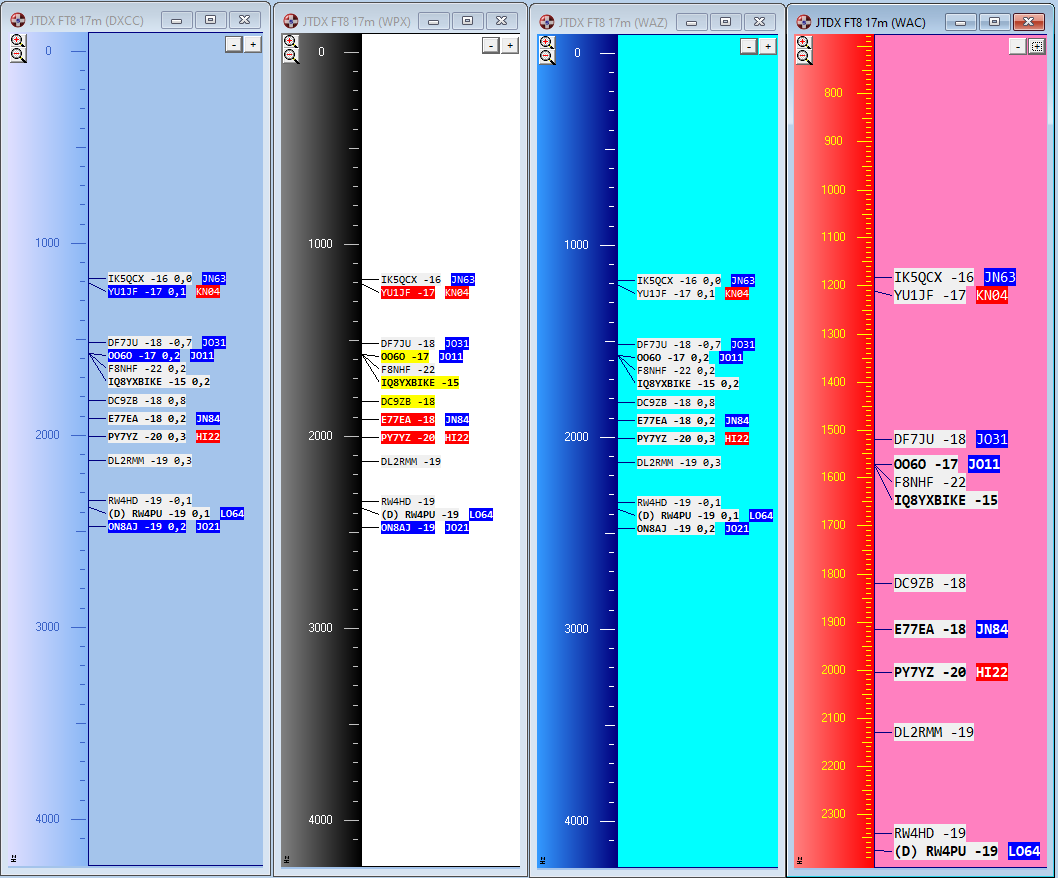
Below you can see some samples of WSJT-X / JTDX / MSHV band maps with different settings. There are infinite combinations!