DXCC Pivot Tables
This page briefly describes the process for creating a Pivot Table based on a
DXCC statistic. If you need more detailed information on Pivot Tables, please
review the main page describing Pivot Tables.
Create a DXCC Pivot Table by Loading an Existing Definition
Working with an existing definition is by far the easiest way to create a
Pivot Table. Briefly stated, there are just four steps:
- Load an existing definition
- Review the results
- Modify the definition as necessary
- Save your customized table for future use
- To create a DXCC Pivot Table click on Wizards ¦
Create Pivot-Table.
- The dialog window Selection of Group-Fields is displayed next:
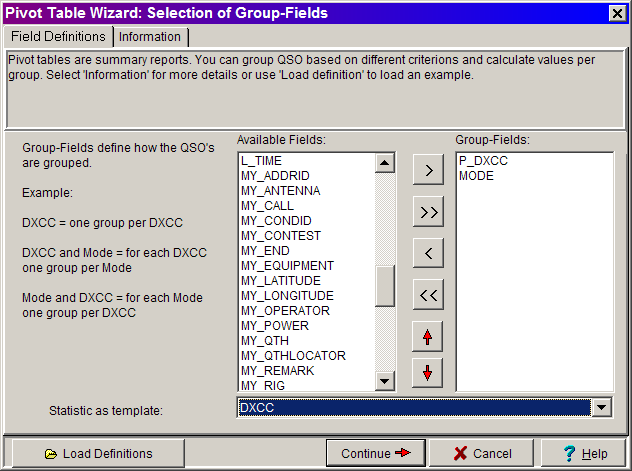
- Press the Load Definitions button.
- The dialog window Load a Pivot Table Definition is displayed next
– your window may look different, depending on the operating system your
computer is using.
Hint: When you press the Load
Definitions button, the Pivot Tables directory should open automatically, if
it doesn't and you have to navigate thru the directories, the Pivot Tables
are located in ...Swisslog\Reports\Pivot Tables and the file extension is .PVT
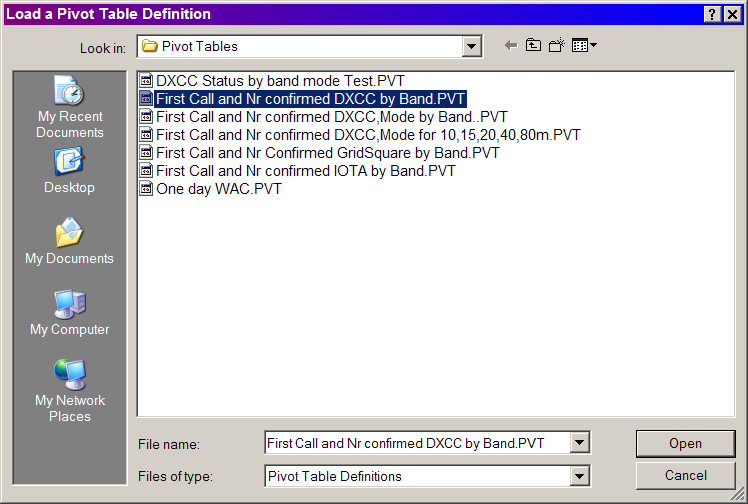
- From the list displayed select the file: First Call
and Nr confirmed DXCC by Band.PVT and press the Open button.
- The dialog window Selection of Group-Fields is displayed again.
- Press the Continue button.
- The dialog window Select and display QSO's is
displayed next:
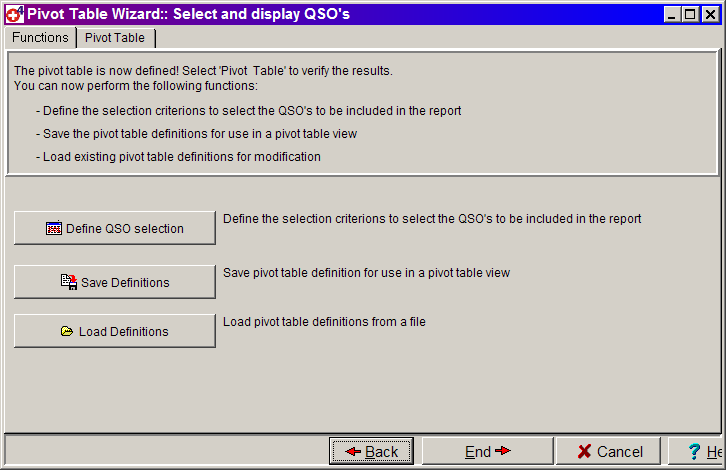
- At this point there are two options, notice the Select and display
QSO's dialog window offers of two pages, there are two tabs at the top
of the window – one for the Functions page and another for the Pivot
Table page. Before exploring the Functions page, click on the Pivot
Table tab to display the results of the Pivot Table at this point.
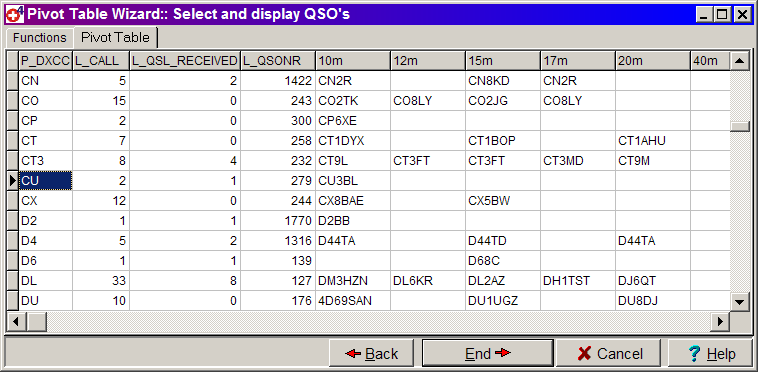
The image above displays the DXCC Pivot Table in the default configuration.
Because there are several bands being displayed along with the 4 columns of
data on the left side of the table, the table will be very wide. You may
decide to eliminate some of the information, or rearrange the columns – you
can move columns by using the mouse to drag them to a new location.
To continue this example, we will go back to the Select and display QSO's Functions
page and make changes there.
- Click on the Functions tab.
The Functions page allows you to select the following Functions:
- Define QSO Selection – this allows you to define the selection
criteria for the QSO's you want to display.
- Save Definitions – allows you to save the definitions you
have created for later use.
- Load Definitions – allows you to reload definitions that were
previously saved.
- Press Define QSO Selection button.
- The second part of the Select and display QSO's dialog window is displayed next. The appearance of
this window is dependent on information you have entered in Swisslog; such
as your Own QTH, QSL-Action, etc.
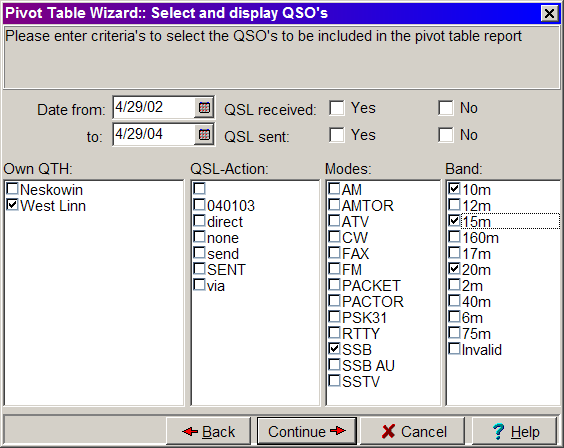
- Using the dialog window shown above you can specify; the range of dates
the table will include, your QTH or select multiple QTH's, the operating
Modes, and Bands that will be displayed in the DXCC Pivot Table. Enter the
selection criteria by checking the appropriate boxes.
In this example, the range of dates has been reduced to a two year period,
rather than including the entire log which is what happens when the date
fields are left empty. The only mode selected is SSB and the Bands selected
are 10m, 15m, and 20m.
- Press the Continue button, this will bring you back to the first
part of the Select and display QSO's dialog
window.
- Now is a good time to save the table if you think you might want to use it
in the future - click on the Save Definitions button. Don't save your
modified table using the default name – enter a new name for the file.
- Now we are ready to display the results – click on the Pivot Table Tab and wait a few moments until the table is
displayed.
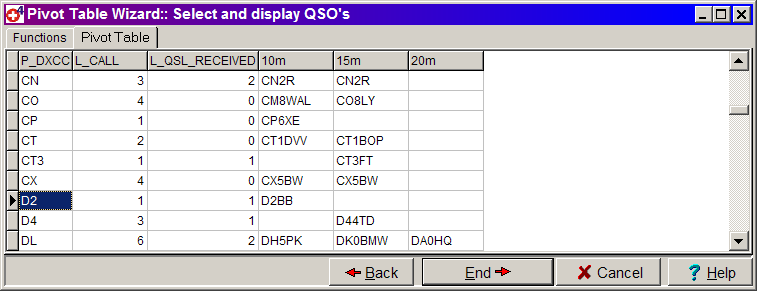
The image above shows the new table which has changed considerably from the
default version. A few of the bands were eliminated by using the Select and
display QSO's dialog window. Also, the QSO
Number (L_QSONR field) was removed. To remove the L_QSONR field from the
table, press the Back button, in the Select Summary-Fields
dialog window select the field or fields to be removed, press the < button
– the selected fields will be moved back to the Available Fields column.
The data in the above image is explained as follows:
P_DXCC – shows the DXCC entity.
L_Call – lists the total number of QSO's which exist for this DXCC.
L_QSL_Received – lists the number of QSL Cards which have been
received from the DXCC.
10m, 15m, 20m, – displays the Callsign of the first QSO on the
applicable band with the DXCC.
Note: the value in the L_Call may not agree with the number of
Callsigns displayed – there may be multiple QSO's for a given Callsign and
all bands are note shown.
Copyright © 2004 SWISSLOG
Last modified: 01 Jan 2005